In the previous chapter a visual version of APL was discussed. In this chapter we use a graphic editor tool to create Mathematica code. As a result of the work in the last two chapters, we make four new design decisions for the language of this chapter. The goal is to create a language that plays to the strengths of the visual medium, while allowing the use of text where appropriate.
In order to take advantage of existing compilers and interpreters, the system is designed to produce code that can be fed into an existing interpreter, in this case Mathematica. We lose the tightly coupled execution of the previous chapter, but gain the power of a symbolic language with thousands of standard routines.
Include in the concept of visual programming the creation of input,
the commenting of code, the design of a system. We allow for the attachment
of text and diagrams to any node in the program we build. Goguen (1985)
states:
Ada's package construct gives a nice way to modularize code. But formal specifications, documentation, designs and requirements should also be modularized, since they too can be difficult or impossible to understand if presented monolithically.
Allow for textual programming where it is more efficient than visual programming; also allow for the mixing of textual and diagrammatic programming. While diagrams are often clearer than textual communication, they are often less compact than their textual equivalent. For certain levels or types of programming, textual representation makes the most sense.
The previous languages allowed for at most two parameters per function.
This language has no restrictions on the number of parameters. This gives
the language the power to visually represent any tree or graph structure,
and handle control constructs from many languages that, unlike APL, call
for multiple parameters.
Graphic editors are available commercially for a number of purposes.
Any graphic editor will allow the drawing of shapes and lines between shapes.
Good ones will maintain connectivity as shapes are moved and manipulated
by a mouse. Most editors are specialized for a particular graphic domain,
such as VLSI designs, organizational charts, or Entity-Relationship diagrams.
Generic graphic editing is based on a two-step process in which a template
of nodes and edges can be created that can be fed into a graphic editor.
This allows for a single graphic editor to function as if it was customized
for a particular visual language; it also allows for a syntax check to
be performed on the drawing as it is built.
We use a commercial example of this from Hekmatpour (1990). The Hekmatpour
package includes a textbook, two binary programs, and their corresponding
source. The first program is called Templa; it allows for the definition
of graphic templates. The second program is called Graphica; it allows
for the creation of diagrams using Templa-created templates. In the work
documented in this chapter, we use an unmodified version of Templa to produce
a template for a visual language, and modify a version of Graphica to create
the diagrams and translate the diagrams into Mathematica code.
Templa allows for the definition of notation families, subnotations,
places, links, and relationships. We now discuss what these terms mean.
Hekmatpour points out that diagrams cluster into notations and subnotations. For example, a tree might be a notation family, containing binary trees, 2-3 trees, etc. Every place, link, or relationship belongs to a subnotation. Notations are an abstraction mechanism that allows a drawing to contain multiple types of diagram. As an example, it is possible to define a state diagram and a circuit diagram syntax and allow subdiagrams of each type to exist in the final diagram; moreover nodes of one type may expand out into nodes of another type.
Places are essentially nodes. They may be made up of visual primitives such as lines, polygons and text. Links can only be attached to places, and diagrams can only be expanded out through places.
A link is a graphic element connecting two places, such as a line or an arrow. Links may have text areas embedded in them, so that it is possible to have labeled arrows.
Relations specify which places can be linked together; they also specify
which places can be exploded into sub-diagrams.
A graphical notation N consists of:
A set of subnotations, called Members.
A set of Objects .
An object is of type Place, Link, or Relation.
An object of type Place or Link can belong to multiple members.
Every Object of type Relation is an element of exactly one Member.
An Object of type Relation for a Member M in N is either:
a 3-tuple [,
,
] with
,
,
M.
As an example, for a Member graph containing the place node
and the link arrow, [node, arrow, node] is a legal relation.
or:
a 3-tuple [, explodes
into,
] with
,
M,
N.
As an example, for a notation topology containing members graph
, tree, and placetreenode tree,
[treenode, explodes into, graph ] is a legal relation.
A subdiagram results from an explosion of a place. At any point in time,
one subdiagram is current, and the type of that subdiagram is the current
subnotation, C. When the program is invoked, there are a set of possible
first subnotations for a diagram. The first subnotation is chosen by the
user from a menu. Then the current subnotation can only change by exploding
the diagram or imploding the diagram. We can formalize the rules:
A place can be drawn
if and only if
C
A link between
two places
,
can be drawn if and
only if
,
,
C
and there exists a relation [
,
,
]
C.
An explosion between a place and
a subdiagram of type new_subnotation can be created or followed
if and only if
C
and there exists a relation [
,
explodes into, new_subnotation]
C.
Template creation consists of the definition of families, and the links,
places, and relations in each of those families. In addition, for each
link and place, a graphic representation is defined from a set of graphic
primitives. 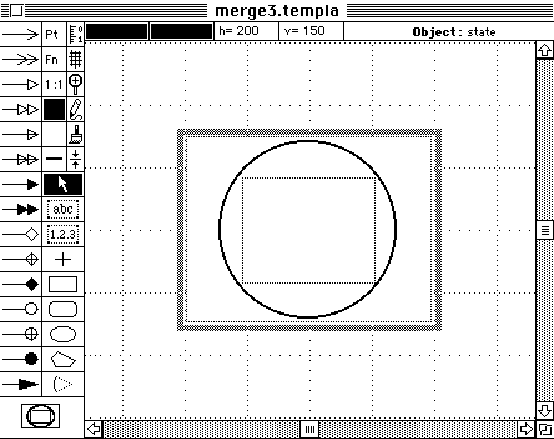
The primitives on the left define the way the place or link will look
when drawn. Icons can also be defined for each symbol for use in the graphic
editor.
The template editor can be used to define a large number of diagram
types. It is possible to create many of the standard computer science diagrams
described in chapter 2, including state diagrams, entity-relationship diagrams,
flow-charts, data-flow diagrams, trees, graphs, weighted graphs, network
flows, Petri Nets, Rothon diagrams, structure diagrams, circuit diagrams,
and associative nets.
Nodes can not be shown enclosed in other nodes, so Nassi-Schneiderman
diagrams or any other containment diagrams such as State Charts cannot
be drawn except as a series of explosions into subdiagrams.
Contiguity is also not supported by the program - places are considered
connected only if an explicit link is drawn. Therefore architectural or
map-like diagrams cannot be made except as bubble graphs.
Nevertheless, it is noteworthy that most diagrammatic representation
can be reduced to minor variations on the drawing of graphs, and that the
variations can be parameterized in terms of node types, links, and relationship
rules.
For the purposes of this chapter, we create a template for use with
Mathematica. The template is sufficiently general that it will handle many
other programming languages; it contains a place called a function that
allows any arbitrary name or function definition to be typed in. We have
tailored the template to include icons for some routines out of Skiena
(1990).
The template includes two families, one for graph data, the other for
graph programs. We include a node called graph data, a member of
graph program, that can explode into the graph data family. Also,
graphic nodes can explode back into programs, and comments can explode
into either graph data, graph programs, or another comment.
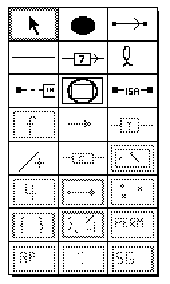
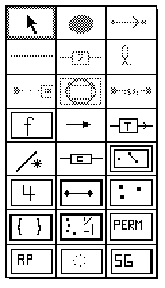
The following two screen dumps show the places and links within the Graph Program family. Note that included are two predefined Mathematica functions - List and ShowGraph, and six predefined functions from Skiena (1990): Cycle, Edges, Vertices, Graph, Permute and RandomPermutation. Hundreds of other Skiena and Mathematica functions can be accessed by using the place called function and typing in the function name.
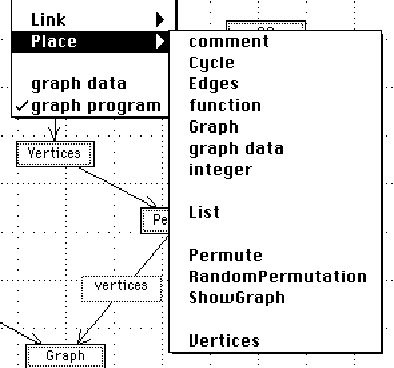
Figure 5.2. The graphic editor:
for each subdiagram we are permitted to draw symbols from the legal alphabet
of places and links. This menu shows the places that can be drawn for the
family graph program. The names shown in capitals are functions
that are part of the Mathematica language; the other ones are generic.
A comment begins as text, but can be exploded into diagrams. A function
is a blank box into which can be typed the name of any available function
in the target environment. Graph data is a node that explodes into
a diagram; the translator will create a data object out of it. Integer
is an integer number box that can be typed into.
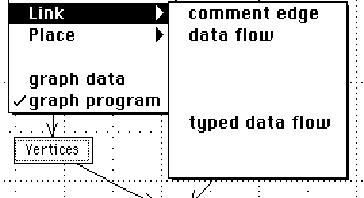
Figure 5.3. The edges available within the graph program.
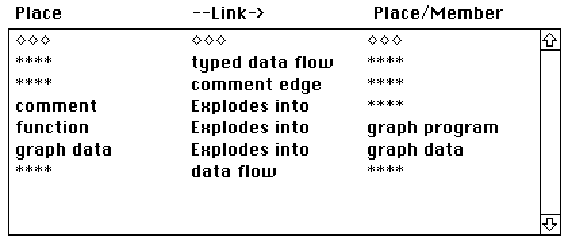
The normal link is a data flow link. The typed data flow link contains
a text area in the link itself to record type information to either feed
the language compiler or to document the program. Finally, a link can be
made from a function to a comment using a comment edge.
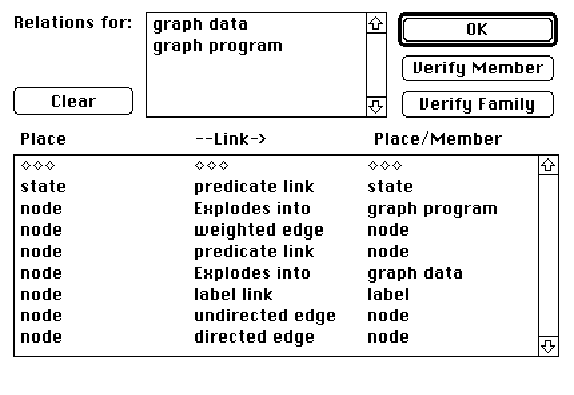
The graph data family allows for graphic data to be drawn. The objective
is to allow the construction of labeled and weighted graphs that can feed
the routines of Skiena. With the set of places and links defined here,
state diagrams and associative nets can be defined as well as graph structures.
This gives us the ability to link design documentation to the code.
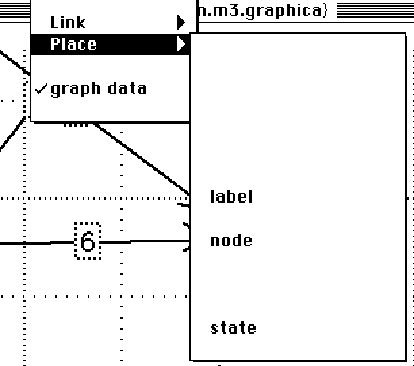
Figure 5.5. For the graph data family,
the three possible places are label, node, and state. A label is a text
box that can be linked to any node. A state actually contains text within
it, and can only be linked using an edge with text within it.
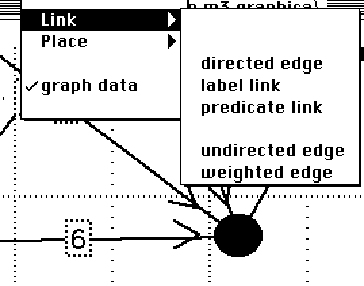
Figure 5.6. The links in the graph data family include
directed, undirected and weighted edges. A label link will link text to
any node. A predicate link will link two nodes or states together with
a text box in the middle of the link. This can be used to create state
transitions for state diagrams or predicates for associative nets.
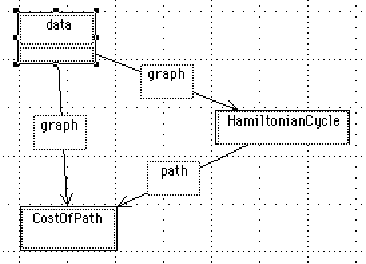
First we create a graphic version of
CostOfPath[data, HamiltonianCycle[data]].
In the figure below, the links between the nodes contain type information.
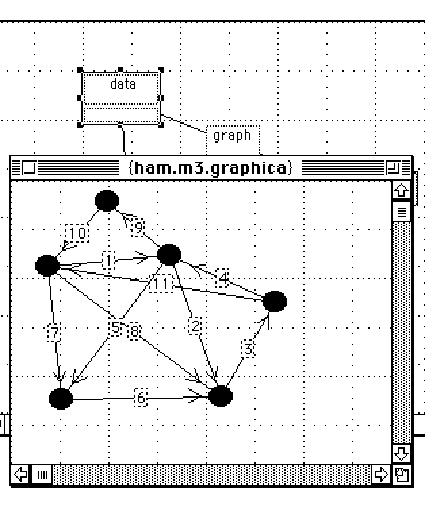
We create the weighted graph by exploding up the data box into a new diagram in the family graphic data. There we draw a weighted graph. In a textual language we would need to generate the example in some textual representation; here the diagram for the data can be created, looked at and edited the same way as the program itself:
While in the above example, the whole program was created visually,
in some cases textual versions are preferable. Here RandomGraph explodes
into a text version of the subroutine:
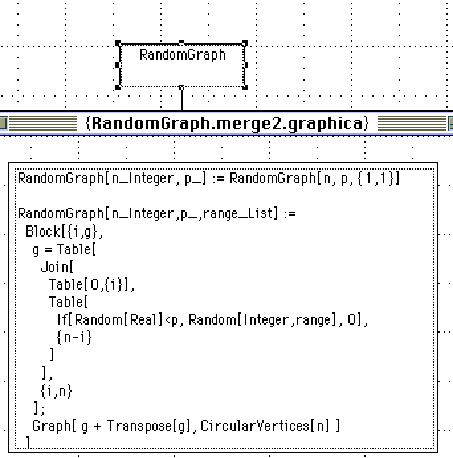
This particular routine could be created graphically, but would take
at least 20 places connected together. The textual version is much more
compact. In addition, if routines like this one have already been coded
textually, the graphic interface essentially works as an outline processor,
allowing the actual underlying source to be examined if necessary.
Mathematica has a loop For statement similar to C; the main difference is that the body of the loop is actually an argument. We show a visual representation of this construction:
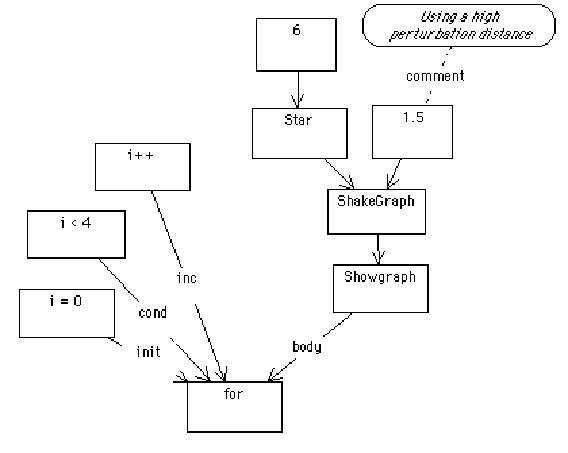
The above diagram translates to:
For[i = 0, i < 4, i++, ShowGraph[ShakeGraph[Star[6], 1.5]]]
When run through Mathematica this produces:

The structure of Mathematica in this case makes loop construction easy;
In Mathematica, all control constructs take arguments, some of which may
be expressions that are large blocks of code.
Here is a flat program with no explosions:
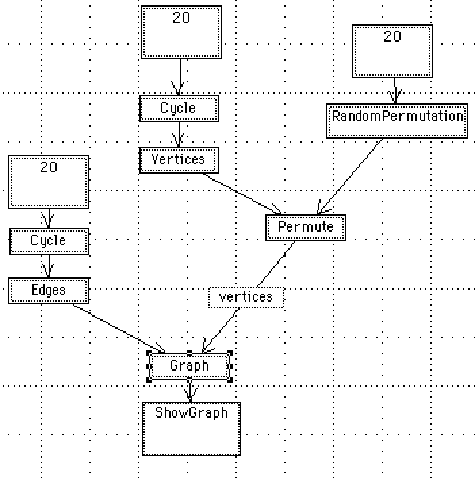
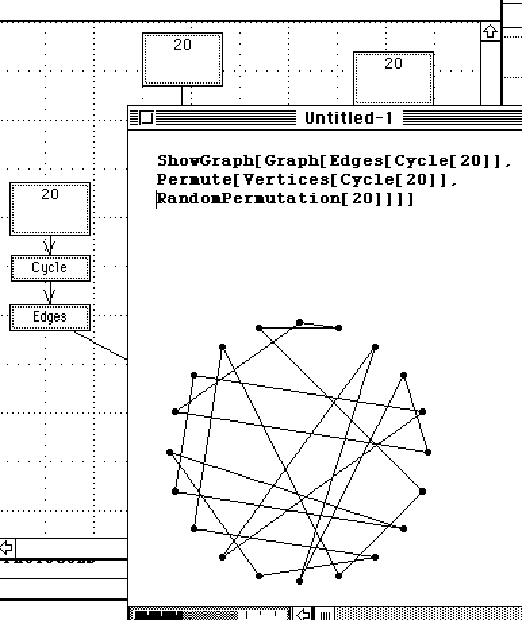
We show how the program currently interacts with Mathematica: the diagram is
translated, producing Mathematica text, which can be inserted into Mathematica
and executed.
Graph traversals can have a semantics attached to them in a manner similar
to the way parse trees are given meaning. Graphs are often traversed to
find a sequence for accomplishing a task or determining a shortest path
through a set of nodes. In the examples above, we view the traversal as
yielding a textual input stream to a compiler. We look at some ways of
translating the traversal. In all cases, we assume that we can parse from
the graph a set of relationships (Points x y), meaning x points
to y, constituting an edge.
The strings associated with nodes can simple be concatenated. For example,
given a number of boxes containing program text, we can assemble a source
file in topological order. (Points a b) -> "a b".
Links may be labeled, and the link itself may be an assertion of a predicate.
A set of predicates can be generated by the traversal. (Points a b)
-> [ISA a b].
A graph may be translated into a predefined data structure for the target language -
(Points a b) -> [Vertices[a, b], Edge[a, b]]. This kind
of translation is specific for the data structure and target language,
and demands either custom code or an attribute grammar tied into a translation
engine. An alternative is to translate into a standard format and force
the conversion on the target language side.
Each string in each node can be interpreted as a function of the next node - so
(Points a b) -> b[a]. Multiple edges are interpreted as multiple parameters, so
(Points a b), (Points c b) -> b[a, c]. This has been how
the Mathematica code has been generated.
Traditional programming environments include the following three elements:
text code, text comments, and text data. Here we allow for the above elements,
but add diagram code, diagram comments, and diagram data. All six of these
elements can be combined and linked together. Comments can always explode
into diagrams, and the data elements of the code can explode into data
diagrams. The value of this depends on the precision with which we can
define the meaning of the diagram we have drawn.
In our goals for the language, we quoted Goguen on the importance of
modularizing design and specifications. Here we have shown a way to link
diagrams to text, as part of the program or as part of a commentary on
the program. It may be that the most powerful aspect of visual programming
is this ability to link design and conceptual information with the program.
Dense programs can be created faster textually, but understood better with
the associated diagrams that motivated the code in the first place.
Goguen(1985) suggests that diagrams of module inter-relationships might
be useful in building, maintaining, and understanding libraries of reusable
code. With some minor modifications it might be possible to create a template
for module interconnection languages. Goguen also suggests that the understanding
of libraries of code would be vastly improved through the use of animation.
The concept of a diagram as the visualization of relations can be readily
expanded to handle relations over time. The problem then becomes one of
how to map the abstractions of programming onto the time domain.
The program was based on the Graphica program of Hekmatpour; the code
was ported to System 7.0 on the Macintosh and modified so that diagrams
can be traversed and translated.